
It took about 40 years to put in 1 million solar installations in the US. The next million took only three years to install (PDF). That’s an acceleration that hasn’t really slowed down. Whether it’s because you’re trying to take advantage of the federal tax credit before it goes away or some other reason, you might be looking to go solar soon.
While the Midwest isn’t California or Arizona, that doesn’t mean putting solar panels on a Midwestern roof is a foolish idea. In many situations, it can be a wise financial decision. Below is some key information on the Midwestern states from which you can hone in on the information specific to your situation. Look here if you live in New England or on the East Coast.
The cost of electricity
We’re taking the Midwest to mean the following states: Illinois, Indiana, Iowa, Kansas, Michigan, Minnesota, Missouri, Nebraska, North Dakota, Ohio, South Dakota and Wisconsin. This group makes up the US Energy Information Agency’s east north central and west north central regions.
Electricity prices in 2020 ranged from $10.22 per kilowatt in North Dakota to $14.32 per kilowatt in Wisconsin. Average monthly bills, which reflect the amount of electricity used as well as the price, landed fairly close to $100: Illinois ($93.98), Indiana ($120.34), Iowa ($107.78), Kansas ($113.52), Michigan ($109.86), Minnesota ($102.11), Missouri ($115.35), Nebraska ($109.30), North Dakota ($113.26), Ohio ($107.30), South Dakota ($121.77) and Wisconsin ($99.42).
These bills are lower on average than other regions in the US, but still amount to well over $1,000 a year. Electricity rates and bills are likely higher now. From 2020 to 2021, the average cost of electricity increased by 4.3%, the largest increase since 2008.
The cost of solar panels
Solar panel installations vary in cost from state to state, roof to roof and contractor to contractor. In order to compare costs across projects, the solar industry talks about the cost of installations in watts per dollar: the total capacity of a solar installation divided by its cost. Solar panel costs are falling, but for uneven reasons. While hardware costs have fallen by about 40 cents per watt per year, the costs associated with sales, labor and installation only fell by 10-20 cents per watt per year.
The average cost of solar panels nationwide is $3.28 per watt according to the analysts at Wood Mackenzie. Thanks to different sources of information, the solar panel marketplace EnergySage finds average prices below Wood Mackenzie’s. EnergySage reports average prices for some of the Midwestern states: Illinois ($2.98), Indiana ($3.25), Iowa ($3.02), Michigan ($3.10), Minnesota ($3.04), Ohio ($2.68) and Wisconsin ($3.02). This list is incomplete because EnergySage doesn’t operate in every state or have enough data to calculate averages. This might be because the Midwest lags behind much of the rest of the country on residential solar.
In a recent presentation to investors (PDF), the solar company Sunrun told investors that in Midwestern states, between 0 and 1% of the available market has adopted residential solar. While other states outside the Midwest are at similar levels, some parts of the country, like New England and the Southwest, are much farther ahead.
The cost of panels is also affected by incentives like the federal investment tax credit for solar, which returns 26% of the cost of a solar panel installation come tax time. The federal tax credit will drop to 22% in 2023 and is slated to end in 2024, though it technically could be extended.
State and local incentives throughout the Midwest are overall, weaker than those in New England, but are not far off from those in the Southeast, where more people are going solar. There is variation throughout the Midwest; you can find more state specific information in the Database of State Incentives for Renewables and Efficiency.
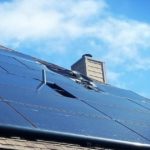
Solar panels generate renewable energy in Michigan.
Stan Rohrer/Getty Images
Nearly every state in the Midwest has a net metering scheme to compensate solar panel owners for the excess electricity they produce. South Dakota does not. Customers there are compensated at an avoided cost rate, which is usually up to the utilities to decide and typically a smaller amount than offered under net metering. Most states also offer exemptions for the property tax increase adding solar panels would incur. They typically offer sales tax exemptions too. Kansas limits the property tax exemption to 10 years. Iowa and North Dakota set the limit at five.
While statewide incentives lag behind other regions, city- and utility-specific incentives exist. Indianapolis, Chicago, Cincinnati and more offer rebates or reduced permit fees. Utilities in Iowa offer rebates for solar panels.
Several Midwest states provide options for people to sell the solar renewable energy certificates their panels generate. Illinois’s SREC market is only open at certain times, when SRECs can be sold on long-term deals up to 15 years. Ohio has its own SREC market and allows nearby states (Indiana, Kentucky, Michigan and West Virginia) to sell within it. This increases supply and drives the price down. An SREC on the Ohio market cost $5.75 at the time of this writing.
The solar potential of the Midwest
The Midwest is toward the bottom for solar adoption so far. The regional leaders are Missouri (187.7 solar installations for every 100,000 people) and Iowa (185.74 installations per 100,000 people). Missouri and Iowa rank 28th and 29th respectively among all states by that metric. The Midwest also has two of the bottom three states for solar adoption: North and South Dakota.
Solar potential isn’t a technical term and can be defined in a few different ways. By one definition — the amount of energy a standardized solar panel would generate if mounted horizontally — the Midwest rates around 4 kilowatt hours per square meter of panel per day (PDF), according to the National Renewable Energy Lab. Four kilowatt hours is about as low as the contiguous US gets. However, in parts of Missouri and South Dakota that same square meter of solar panel would produce closer to 5 kilowatt hours per day and in Kansas and Nebraska it’s closer to 6.
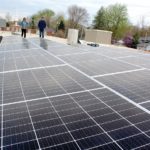
An atypical house near Chicago gets some of its power from solar panels.
benkrut/Getty Images
By another measure — how much of the average electricity bill the average residential solar array could offset — the outlook is much better. While the average solar array in Minnesota and Missouri would offset 60-70% of an average electricity bill, according to the same NREL study. In Iowa, Indiana, North Dakota and Ohio, it’s 70-80% and in Illinois, Kansas, Michigan, Nebraska and South Dakota it’s 80-90%. In Wisconsin it’s 90-100%.
While other parts of the country have more sun and stronger incentives, there are still significant savings on energy to be gained from solar panels in the Midwest.
This is an overview, though, and each person going solar will have a different calculus to make, given the impact of roof design and direction, energy usage and the availability of solar installers. The general information shows that solar in the Midwest could be worth a longer look.


Recent Comments